Overview
KlaudiaAI is now available across all of Komodor's investigation capabilities. You can now share investigations with colleagues as well as ask Klaudia follow up questions that you may have, including across other services!
Prerequisites
- KlaudiaAI needs to be enabled for the account by the
account-adminin the features page. - For more complex cases, Klaudia may provide further details around the investigation being run as well as showing a delay banner.
Workload Based Assistance
Detection & Analysis:
- Identifies workflow and pod failures (e.g., CrashLoopBackOff state).
- Correlates logs and events to pinpoint root causes.
AI-Driven Root Cause Analysis:
- Highlights specific misconfigurations (e.g., YAML syntax errors).
- Points out incorrect settings in Kubernetes resources.
Suggested Remediation:
- Provides precise fixes (e.g., correcting YAML indentation).
- Links to affected resources for quick troubleshooting.
Automated Insights & Evidence Collection:
- Extracts logs, configurations, and errors automatically.
- Displays YAML errors directly within the investigation panel.
Interactive Troubleshooting:
- Enables real-time investigations with options to restart analysis.
Failed Deploy & Workflow Assistance
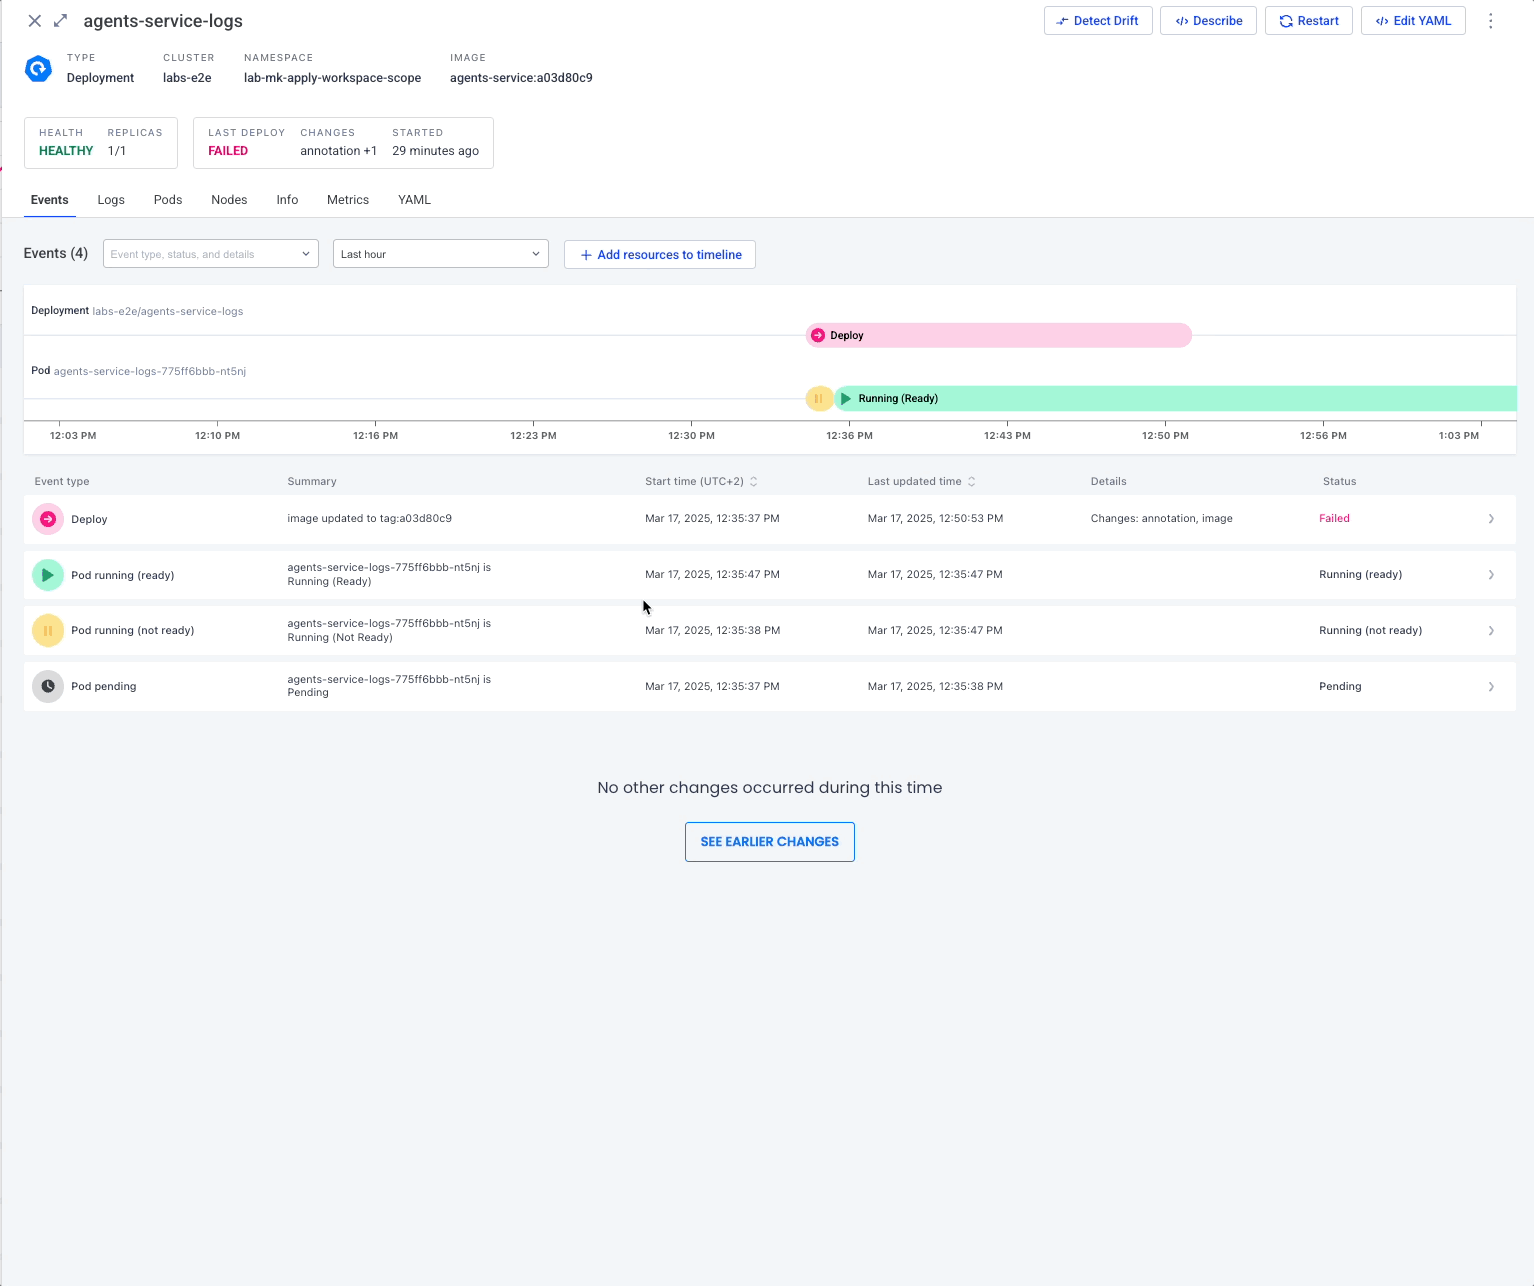
Detects Deployment Failures
- Identifies failed deployments and flags them in the Komodor UI.
- Tracks deployment events and failure points.
Provides Timeline & Event Breakdown
- Displays a timeline of deployment events, including pod states like:
- Pending
- Running (not ready)
- Running (ready)
- Shows key failure points (e.g., image update failure).
Correlates Events with Changes
- Links failures to configuration changes (e.g., image updates, annotations).
- Helps identify what changed before the failure occurred.
Suggests Remediation Steps
- Highlights potential causes like:
- Incorrect image tags
- Missing dependencies
- Misconfigured environment variables
- Provides recommendations to fix issues.
Enables Quick Investigation & Fixes
- Offers direct actions like:
- Restarting the deployment.
- Editing YAML configurations.
- Detecting configuration drift.
KlaudiaChat - BETA
KlaudiaAI now supports two powerful chat capabilities to enhance your Kubernetes troubleshooting experience:
- Klaudia Chat for RCA – Dive deeper into RCA results with follow-up questions and guided resolution.
- Klaudia Chat for Any Resource – Start a conversation with Klaudia from any Kubernetes resource, even if it’s healthy, and get contextual insights on the fly.
⭐️ Motivation
Troubleshooting doesn’t stop at the first RCA. Often, you need to:
- Clarify what a finding means
- Understand resolution steps and prevention
- Investigate related resources
- Assess the broader impact of a change or failure
And sometimes, you just want to understand how a healthy resource behaves or fits into your environment. With Klaudia Chat, you now have a virtual SRE available on demand—whether you’re working on a live issue or exploring infrastructure.
Key Capabilities
RCA-Focused Chat
When viewing any Klaudia Root Cause Analysis (RCA), you can:
- Ask follow-up questions like “What does this finding mean?”
- Get step-by-step resolution guidance
- Investigate related logs, events, or changes
- Share the conversation with your team via the “Share link” button
With Klaudia Chat, we’ve redefined how problems are addressed. This feature provides you:
- Reduced Mean Time to Resolution (MTTR): Faster insights lead to quicker resolutions.
- Interactive Problem Exploration: A back-and-forth conversation simplifies troubleshooting.
- Deeper Insights: Leverage Klaudia’s expansive knowledge base for comprehensive answers.
- Adaptable Investigation Paths: Branch into related issues that the initial RCA doesn’t immediately cover.
Chat from Any Resource
You can now open the “Ask Klaudia” button directly from any resource - Pods, Configmaps, secrets, Nodes etc..
Klaudia will scope the conversation to the selected resource and provide:
- Contextual answers about the resource's state and behavior
- Suggested quick questions tailored to that specific resource type
- Explanations of metrics, changes, dependencies, and more
Detection & Analysis
Klaudia uses Komodor’s event intelligence and investigation engine to:
- Identify issues and correlations across the cluster
- Connect logs, events, and configurations to uncover root causes
- Leverage user prompts to refine answers with context
What You Can Ask
Whether you’re inside an RCA or exploring a pod, you can ask:
- “Why did this happen?”
- “How do I fix it?”
- “What changed recently?”
- “Which services are related to this?”
- “Has this occurred before?”
- “What does this config mean?”
Klaudia responds with real-time, tailored insights that help reduce MTTR and improve platform understanding.
Want to share the entire conversation with a teammate? Click the “Share link” button next to the RCA results.
Using Klaudia RCA via Komodor API
Klaudia’s Root Cause Analysis (RCA) is now available through the Komodor API—enabling teams to trigger and retrieve AI-powered investigations directly from their existing toolchains and workflows.
Available Endpoints
-
Trigger RCA Investigation
POST /api/v1/klaudia/rca
Initiates an RCA for a specific Kubernetes workload such as a Pod, Deployment, or Job. -
Retrieve RCA Results
GET /api/v1/klaudia/rca/{session_id}
Returns a detailed analysis including the identified root cause, confidence score, supporting evidence, and suggested remediation steps.
API Usage Pattern
Since investigations typically take 20-30 seconds to complete, we recommend implementing a polling pattern:
- Start an investigation using
POST /api/v1/klaudia/rca - Receive a
session_idin the response - Poll the results endpoint
GET /api/v1/klaudia/rca/{session_id}until the investigation is complete - Process the returned root cause analysis and recommendations
This asynchronous pattern ensures your integrations remain responsive while Klaudia thoroughly analyzes the issue.
🌟 Here is an example script you can use in your CI/CD
Why Use the RCA API?
- Automate post-deployment troubleshooting by integrating directly into CI/CD tools like Jenkins, GitLab, or CircleCI
- Enhance incident response workflows in alerting platforms like PagerDuty and OpsGenie
- Bring RCA insights into ChatOps tools such as Slack or Microsoft Teams
- Centralize visibility by embedding RCA outputs into dashboards and internal ticketing systems
Getting Started
Explore the new endpoints in our public Swagger documentation. The RCA API uses the same Komodor authentication and permission model you’re already familiar with.
Comments
0 comments
Please sign in to leave a comment.